Monitor2: Difference between revisions
| Line 25: | Line 25: | ||
|- | |- | ||
|<code style="white-space: nowrap;">/home/cephmonitor/[[Monitor2#samples|samples]]</code> | |<code style="white-space: nowrap;">/home/cephmonitor/[[Monitor2#samples|samples]]</code> | ||
|Top level directory under which, firstly, sampled/graphed hosts are collected in | |Top level directory under which, firstly, sampled/graphed hosts are collected in [[Monitor2#plot_pools|plot pool]] directories | ||
|- | |- | ||
|<code style="white-space: nowrap;">/home/cephmonitor/cgi-bin</code> | |<code style="white-space: nowrap;">/home/cephmonitor/cgi-bin</code> | ||
Revision as of 16:54, 26 April 2023
The second monitoring system/framework in the New World (monitor2) is implemented on the server https://nw-syd-monitor2.cse.unsw.edu.au/. Unlike monitor1 it does not use Nagios and, implicitly, does not generate any sort of alarms.
Instead, monitor2 collects and graphs data sampled from various servers. It is designed to implement a simple but flexible way of collecting data from these hosts, storing it and graphing it, regardless of the type of data. It uses SNMP to collect data samples from the monitored hosts. Where the standard SNMP MIBs don't define the data samples we want to collect, we extend SNMP with external scripts (written in bash) to provide the required samples.
As of the date of writing, it supports:
- Disk activity (bytes read and written per local disk/partition)
- Network interface traffic (bytes read and written per network interface)
- CPU usage (percentage) and load average
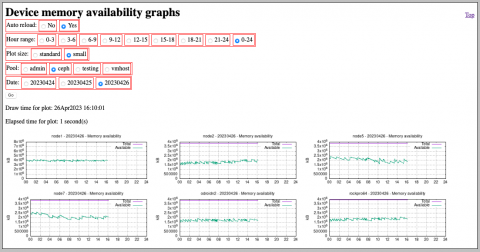
- Memory usage (RAM)
- Device temperature(s)
Location of files
monitor2
| monitor2 files and directories | Description |
|---|---|
/etc/monitor2.conf
|
Site-specific configuration: top-level directory location, etc. |
/home/cephmonitor/samples
|
Top level directory under which, firstly, sampled/graphed hosts are collected in plot pool directories |
/home/cephmonitor/cgi-bin
|
Directory containing Bash CGI scripts for each graphed data type. They use a common library to display pages with similar-looking controls at the top and graphs underneath |
/home/cephmonitor/plot-bin
|
? |
/home/cephmonitor/html
|
Static HTML pages, including index.html which contains links to the CGI scripts
|
/home/cephmonitor/bin
|
? |
/home/cephmonitor/datacollectpoll
|
Directory containing the datacollectpoll |
/etc/systemd/system/datacollectpoll.service
|
systemd service file used to control our datacollectpoll service
|
Monitored hosts
| Files and directories on the monitored hosts | Description |
|---|---|
/etc/snmp/snmpd.conf
|
Configuration file for the SNMP daemon running on the host. It contains the community name plus it lists the scripts used to extend the range of data the daemon can provide |
/usr/local/snmpd_extend
|
Directory containing the extension scripts referred to by snmpd.conf
|
monitor2.conf
SAMPLERETRIES=3 SAMPLETIMEOUT=2 SNMPCOMMUNITY="reader" DEFAULTPLOTPOOL="ceph" DATADIR="/home/cephmonitor/samples" DATACOLLECTPOLLCONF="/home/cephmonitor/datacollectpoll/datacollectpoll.conf" |
datacollectpoll.service
[Unit] Description=Data Collect Poll daemon for fleet monitoring After=network.target [Service] User=cephmonitor Group=cephmonitor EnvironmentFile=/etc/monitor2.conf ExecStart=/home/cephmonitor/datacollectpoll/datacollectpoll [Install] WantedBy=multi-user.target |
datacollectpoll
Immortal script (i.e., never intentionally dies) run by systemd which runs commands at intervals listed in datacollectpoll.conf to collect data samples and store them in plain-text files in the samples directory.
samples
Directory and subdirectories with plain-text files containing daily collections of data samples named by type and host.
